Overview
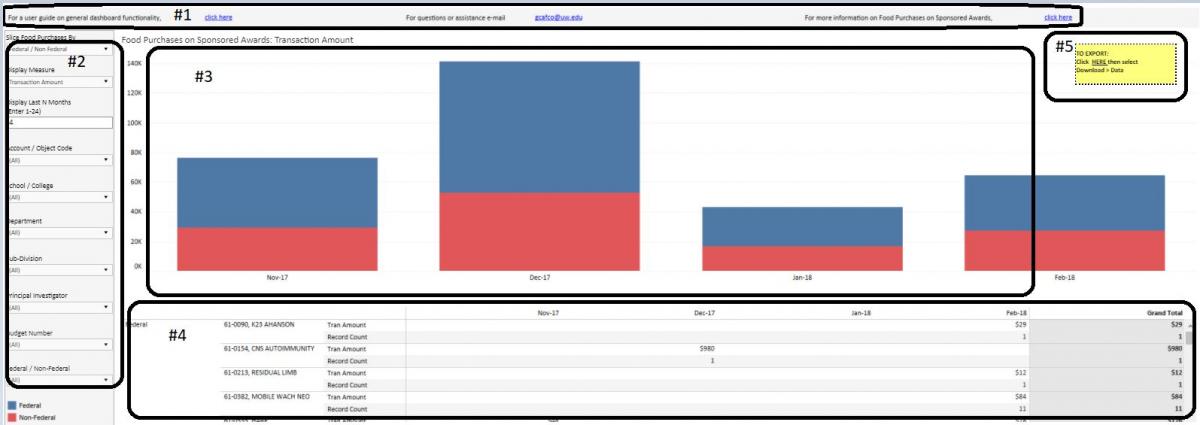
This User Guide provides a basic understanding of the features and functionality of the Fiscal Compliance Dashboards. There are five main parts to each Dashboard.
- Help: includes a link to this User Guide; an email address to request help; and a link to more information about each dashboard
- Filters: allow the user to select which data to show in the Chart and Table sections
- Chart: displays selected data in both a bar (vertical axis) and by month/year (horizontal axis)
- Table: displays selected data by Budget Number
- Export: allows the user to download selected data into Excel
For navigation, use "Revert" to go back to the default settings.

Part 1: Help
Across the top of each dashboard are links to:
- This User Guide
- Email gcafco@uw.edu for questions or assistance
- PAFC web pages with more information about each specific dashboard
Part 2: Filters
Use the filters to select the data to display in the chart and table.
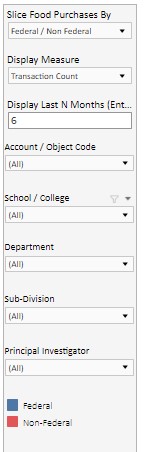 The first filter determines how the data in the chart is displayed. A color key appears beneath the filters. The filter options are unique to each Dashboard.
The Display Measure has two options:
- Transaction Amount: data in the Chart and Table is displayed by the dollar value of the transactions
- Transaction Count: data in the Chart and Table is displayed by the number of transactions
Display Last N Months selects the number of months to show from the most current month available (the last month that has closed).
For example, if the most current month available is December 2020 and the user selects six months to display, the data displayed will be the last six months from December 2020 (July – December 2020).
The monthly data upload is completed by the 10th day of the month following the reporting month. For example, the November 2020 data became available by December 10, 2020.
All other filters are standard. Filter settings cannot be saved; they must be re-applied each time the user accesses the dashboard.
Tips for Using Filters
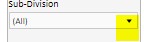
- To select item(s) from a drop down list, uncheck the “All” box, then check the item(s) from the available list
- Select a single item by using the search box in each filter:
 Click the down arrow in the filter box
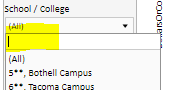 Enter the search term in the search box that appears at the top of the drop down list
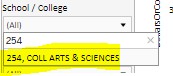 Click on the item when it appears in the drop down list
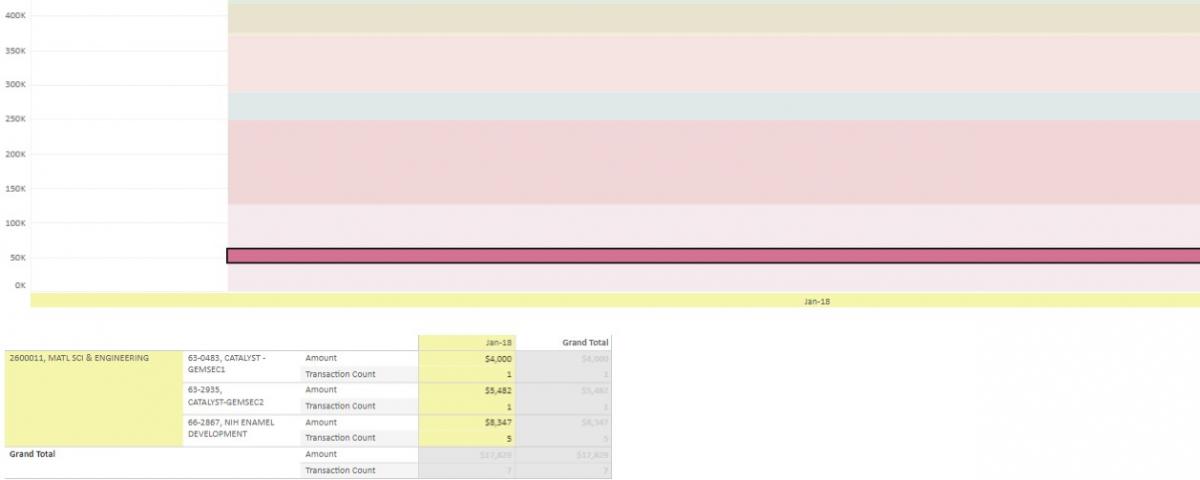
Part 3: Chart
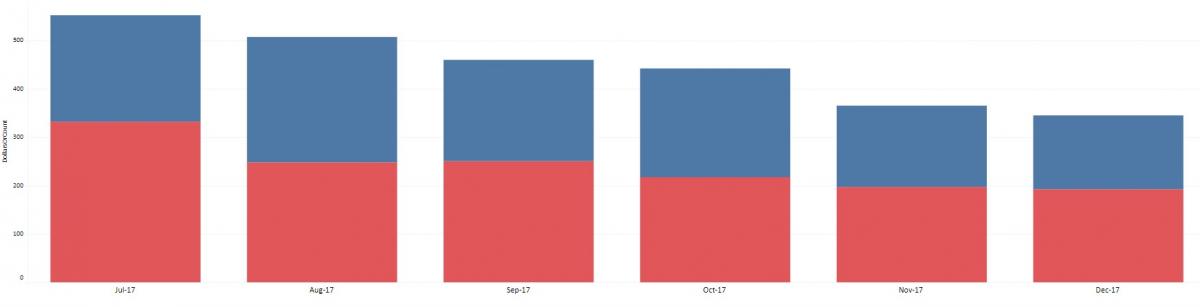
The Chart displays data based on the selections in the filters.
The color blocks are determined by the drop down item selected in the first filter. A color key appears underneath the filters.
The vertical axis displays the data based on the Display Measure selected in the second filter, either Transaction Amount or Transaction Count.
The horizontal axis displays the Month/Year as selected in the Display Last N Months filter. Tableau only allows data to be selected from the most recent month back.
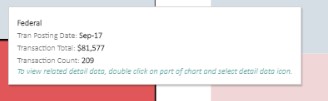
Hover over a color block in the chart to display a pop-up that summarizes that block's data.
Click on a color block in the chart to display a pop-up menu:
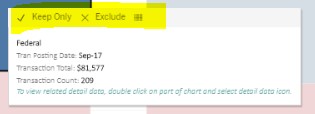
Keep Only: only the selected data will appear in the Chart
Exclude: the selected data will be excluded from the Chart
View Data: opens up the Tableau export functionality for the underlying transaction data. Tableau does not allow for customization and thus presents the data in a less-than-ideal format. See Part 5: Export for best practices on exporting data.
Part 4: Table
The table organizes the selected data based on the first filter and includes budget numbers and budget names. Data from the horizontal axis is organized by Month/Year.
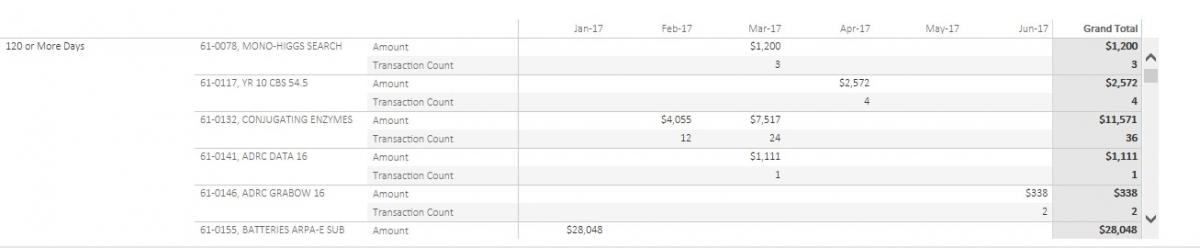
Click on data in the table to highlight the transaction details in the table and the corresponding data in the chart.
Part 5: Export
Detailed transaction data can be exported using the UW custom format or Tableau functionality. We recommend using the UW custom format.
UW Custom Format
To export transaction details of the filtered data:
- Ensure that no part of the Chart or Table is selected (highlighted): click any part of the white background of the chart to be sure. If any part of the Chart or Table is highlighted, only the highlighted data will be downloaded.
- Click on “HERE” in the yellow “Export” box on the top right
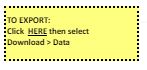
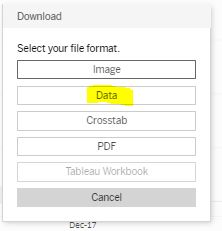
- On the upper right menu bar, click on “Download” and select “Data” from the drop down list.
- WARNING: Do not select "Crosstab" from the list; the data will download but the dataset is incomplete. Tableau has been advised of this error but there is currently no fix and the option cannot be disabled.
- A separate page will open:
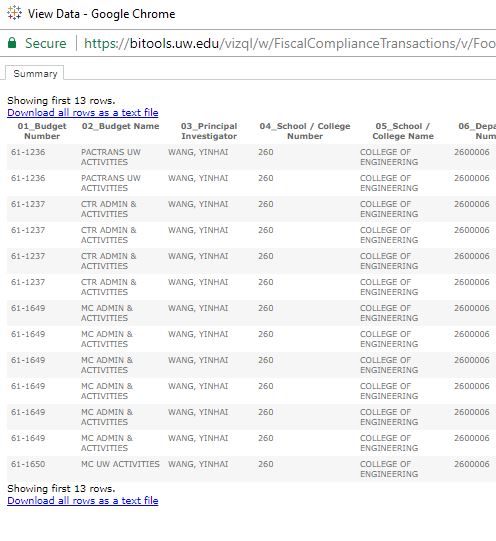
- To export the data into Excel, click on the link to "Download all rows as a text file."
Tableau Functionality
As described in Part 3: Chart, users can click on a color block in a Chart or a selection in a Table to open a dialog box with the option to View Data. The View Data option will export the data, but the content, format, and presentation are not ideal and Tableau does not allow for customization.
If users select the upper right menu bar Download/Crosstab function without first selecting the yellow Export button, the data will be based on the last place the user clicked on the Dashboard, and the data will be fixed by Tableau and cannot be customized.
We recommend using the UW Custom Format.
Cost Transfer Dashboards: Transfers From/To Detail
The cost transfer dashboards display the detailed information entered into MyFD when the Cost Transfer was created. This includes the person who created the Cost Transfer, the person who approved the Cost Transfer, and responses to the two or three (as appropriate) questions in MyFD. This data is most easily viewed using the Export function described in UW Custom Format above.
![]()